
South Tampa Luxury Real Estate Is Becoming a Market of Micro-Markets
What Buyers and Sellers Should Understand This Fall
South Tampa's luxury real estate market is becoming increasingly segmented as we enter fall 2026. An analysis of 552 single-family home sales at $1 million or more across ZIP codes 33606, 33609, 33611, and 33629 during the trailing 12 months shows that market conditions differ substantially by price tier, micro-location, waterfront status, and individual property characteristics.
As of early September 2026, 201 single-family homes at $1 million or more were actively offered for sale across those same ZIP codes — approximately 4.4 months of apparent supply based on the prior 12-month sales pace. That aggregate figure, however, conceals a more important story.
Below approximately $2.5 million, supply remains relatively contained. Above that threshold, buyers generally have more alternatives, marketing periods lengthen, and property-specific differentiation becomes increasingly important.
There Is No Single South Tampa Luxury Market
The differences among South Tampa's luxury submarkets are meaningful, not statistical noise.
Among $1 million-plus single-family sales during the trailing 12 months, 33606 recorded a median sale price of approximately $2.15 million and a median price per square foot of approximately $635. In 33629, the median sale was approximately $1.67 million at $506 per square foot. In 33609, approximately $1.52 million at $458 per square foot. In 33611, approximately $1.35 million at $437 per square foot.
Experienced South Tampa buyers already understand what those numbers reflect: two properties separated by a few miles can represent genuinely different real estate assets.
The same is true within individual ZIP codes. A waterfront property on Davis Islands is not necessarily comparable to an interior Davis Islands home. A waterfront home in Sunset Park Isles requires different analysis from a non-waterfront property elsewhere in 33629. Lot characteristics, elevation, waterfront orientation, seawall and dock infrastructure, architecture, condition, construction quality, and redevelopment potential can all materially affect value.
At the luxury level, ZIP code is only the beginning of the valuation discussion.
Luxury Inventory Shifts Above $2.5 Million
The most important pattern in the current data emerges when the market is separated by price tier.
| Price Range | 12-Mo. Sales | Active | Apparent Supply |
|---|---|---|---|
| $1M–$1.5M | 235 | 57 | 2.9 months |
| $1.5M–$2.5M | 193 | 60 | 3.7 months |
| $2.5M–$5M | 103 | 63 | 7.3 months |
| $5M+ | 21 | 21 | 12.0 months |
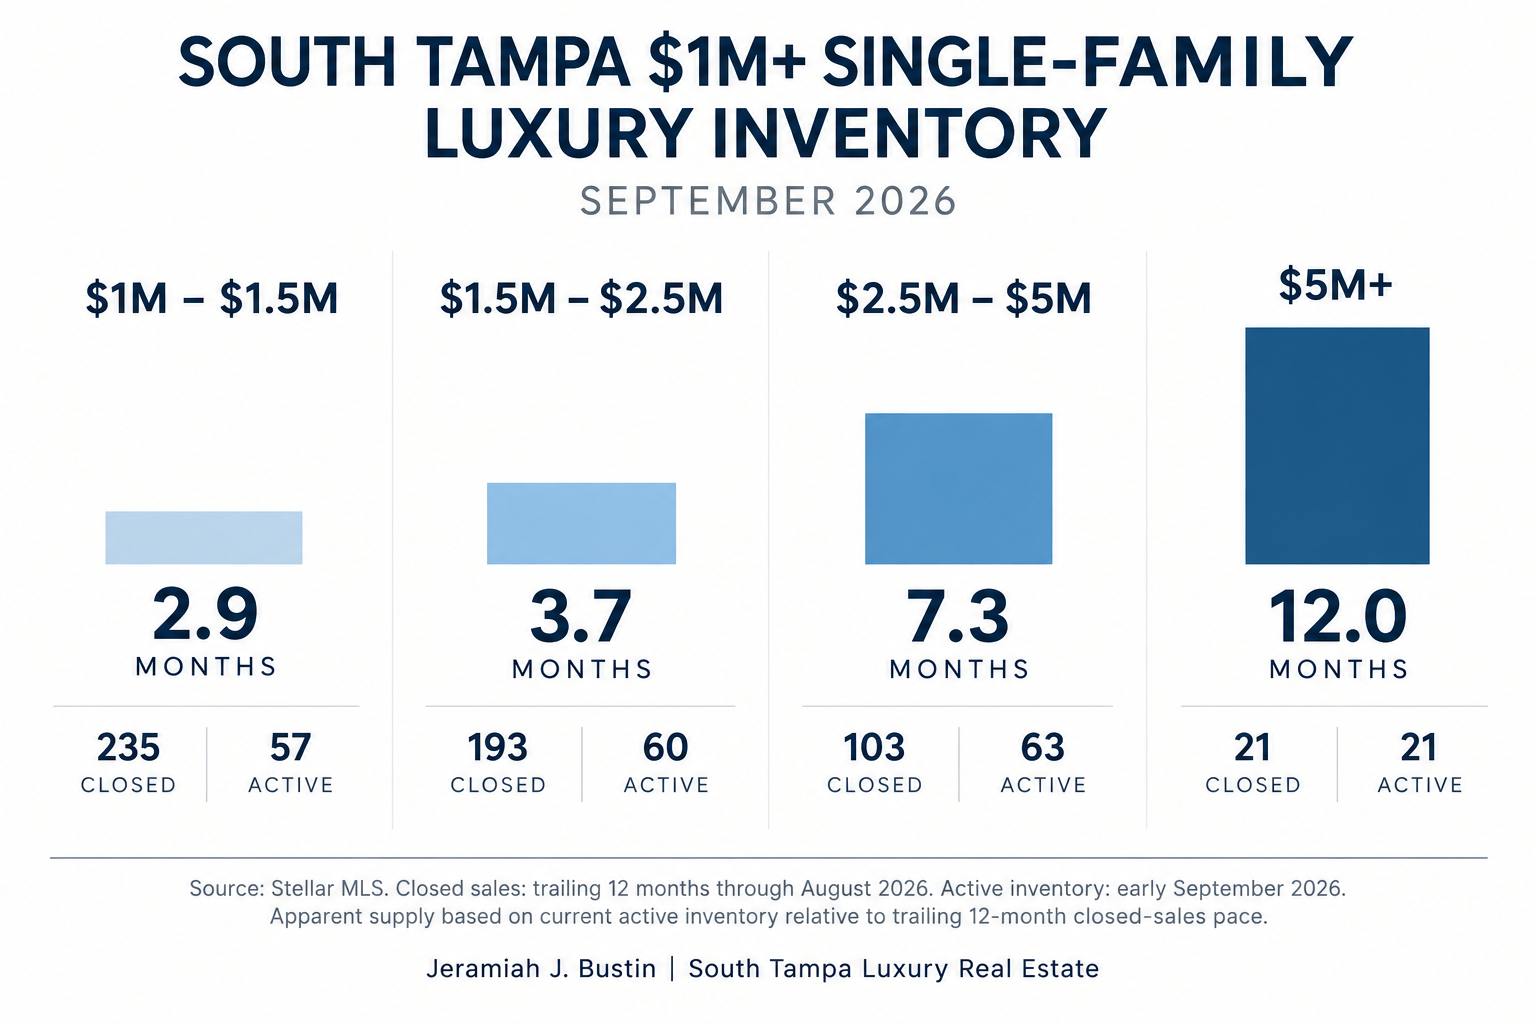
Between $1 million and $1.5 million, 235 properties closed during the trailing 12 months against 57 active listings — approximately 2.9 months of apparent supply. Between $1.5 million and $2.5 million, that figure rises to approximately 3.7 months.
Between $2.5 million and $5 million: approximately 7.3 months. At $5 million and above, there are currently 21 active listings — the same number of properties that closed during the entire preceding 12 months — representing approximately 12 months of apparent supply based on the trailing sales pace.
This doesn't mean every property above $5 million is overpriced, nor does it suggest the upper-luxury market lacks demand. The more precise interpretation is this: as prices rise, transaction volume declines, the number of alternatives increases relative to that transaction volume, and buyers can become considerably more deliberate about which properties justify a premium.
Source: Stellar MLS. Single-family homes, $1 million+, ZIP codes 33606, 33609, 33611, and 33629. Closed sales reflect the trailing 12 months through August 2026; active inventory was measured in early September 2026. Apparent supply is calculated using current active inventory relative to the trailing 12-month closed-sales pace.
Scarcity Still Commands a Premium
The $5 million-plus segment illustrates an important distinction: scarcity and liquidity are not the same thing.
Those transactions achieved a median price of approximately $1,098 per square foot during the trailing 12 months — more than double the approximately $500 median across the entire $1 million-plus dataset. Buyers will pay substantially more for certain South Tampa properties.
But those same transactions carried a median cumulative market time of approximately 116 days, compared with 42 days across the broader luxury dataset. Current $5 million-plus inventory shows a median cumulative market time of approximately 127 days.
The lesson is not that exceptional properties don't sell. It is that an extraordinary waterfront property, architecturally significant residence, or difficult-to-replicate location may command a substantial premium precisely because it is scarce — while the number of buyers capable of purchasing that particular asset at that price may also be limited.
Luxury sellers need to distinguish between scarcity value and aspirational pricing. The former is supported by the property's characteristics and the alternatives available to a buyer. The latter, eventually, has to confront the market.
South Tampa Waterfront Real Estate Requires Property-Specific Analysis
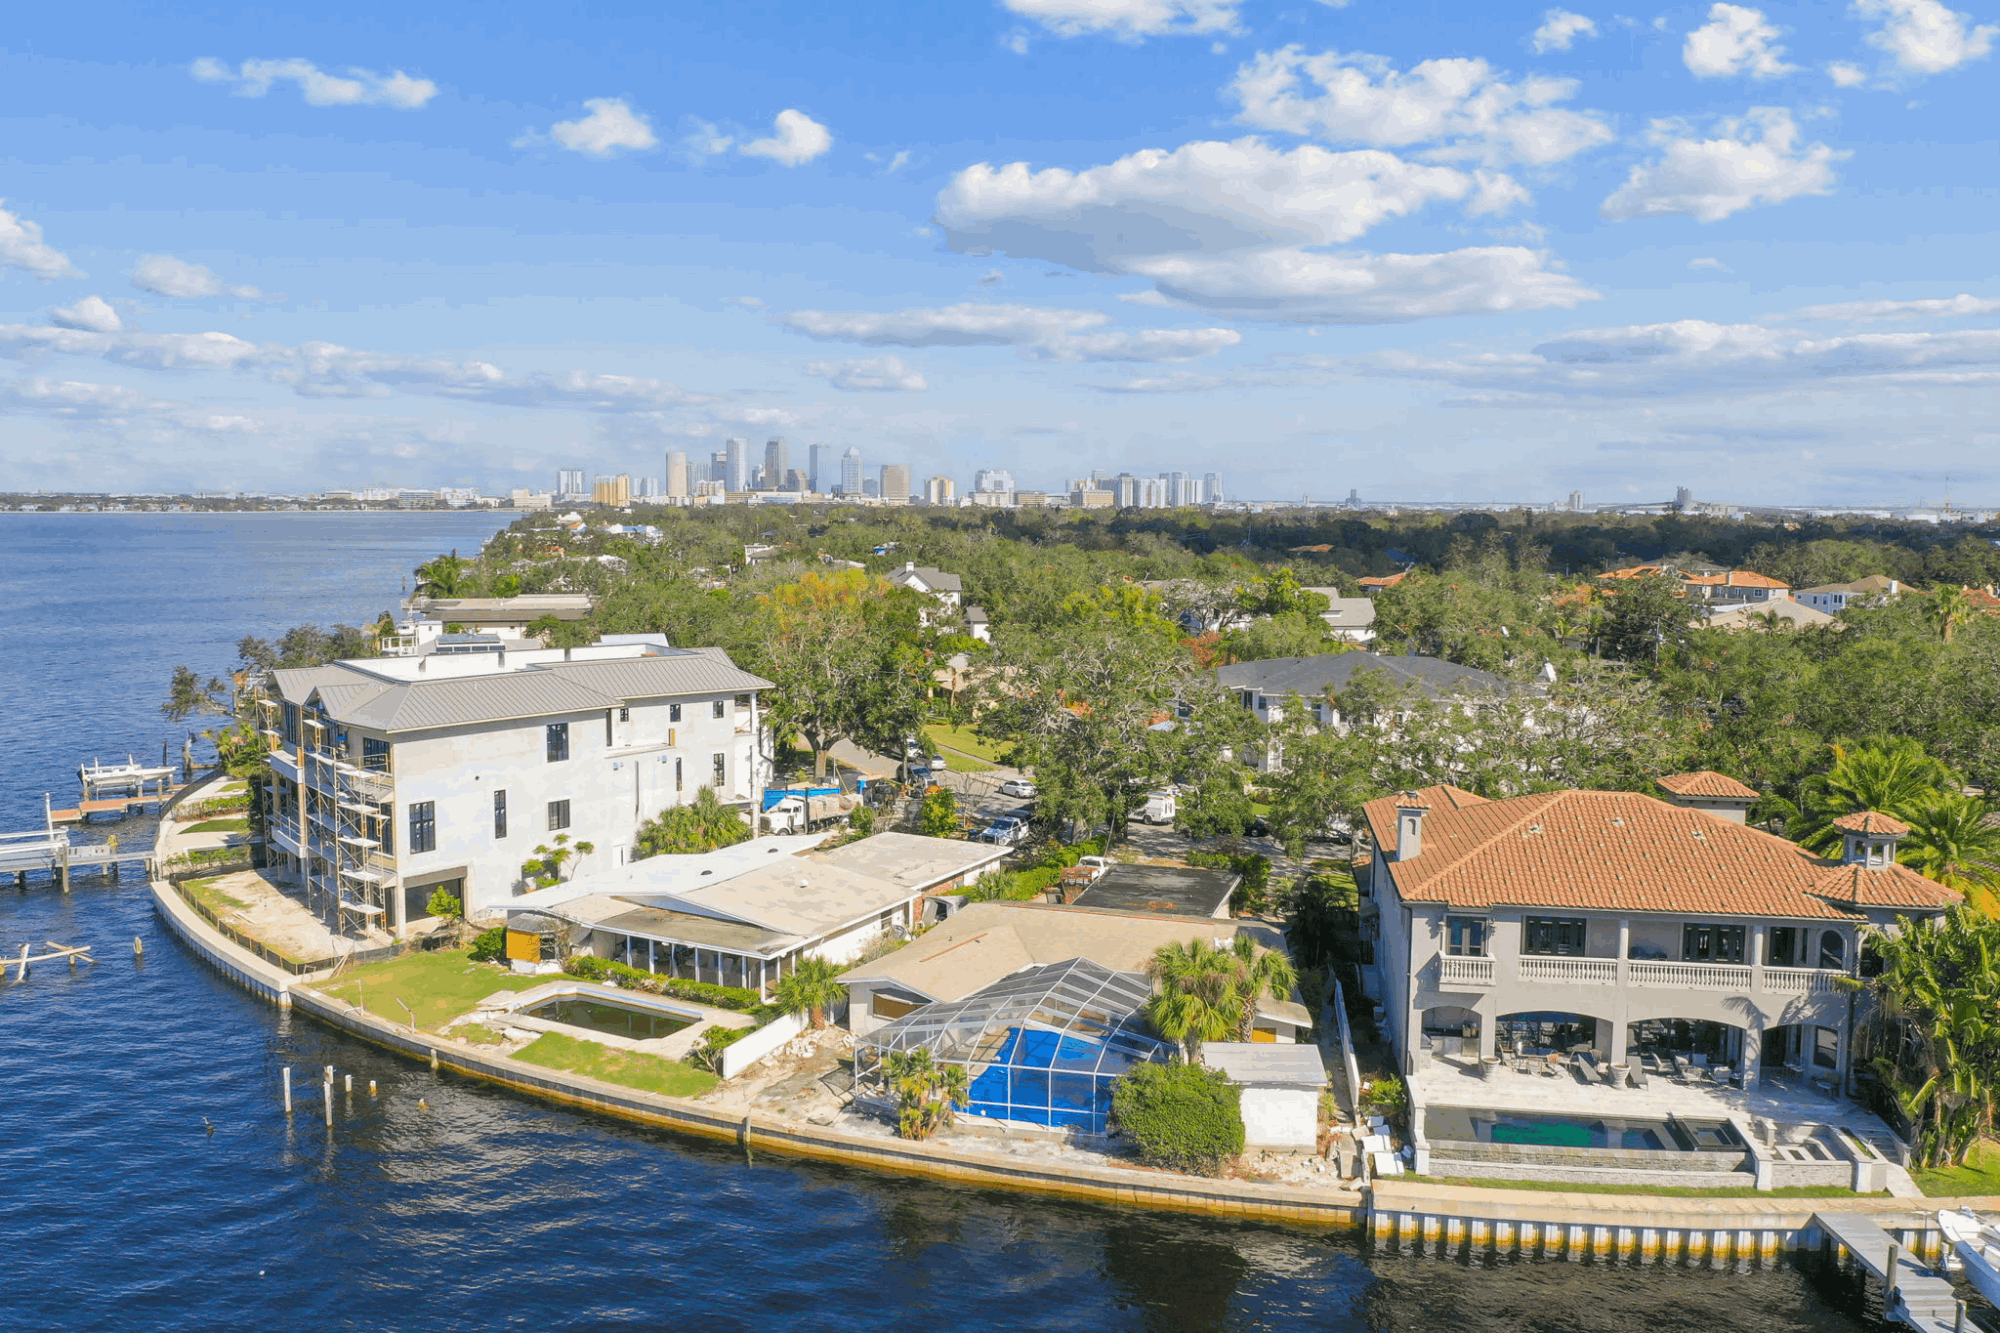
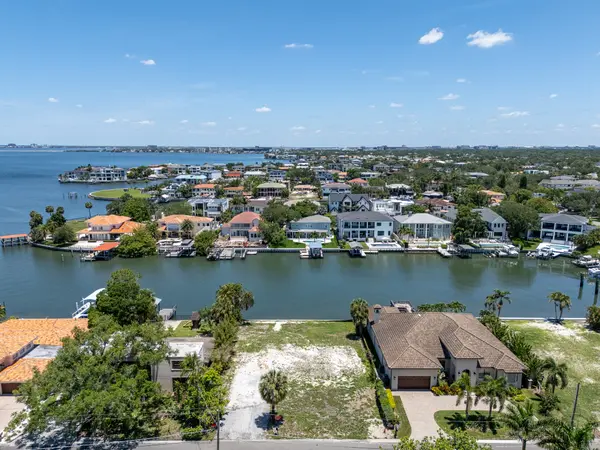
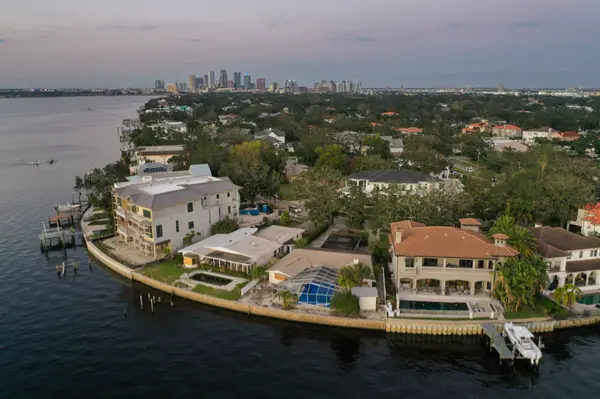
Nowhere is the micro-market concept more evident than in South Tampa waterfront real estate.
During the trailing 12 months, the Davis Islands waterfront subset in this analysis produced only 12 single-family transactions at $1 million or more. The median sale price was approximately $5.02 million, with a median of approximately $953 per square foot. Those properties also recorded a median cumulative market time of approximately 153 days.
The 33629 waterfront subset — including areas such as Sunset Park and Culbreath Isles — produced 18 transactions with a median sale price of approximately $3.11 million at approximately $772 per square foot. The Beach Park waterfront subset was smaller still, with six transactions during the trailing period.
These are small samples, and they should be treated accordingly. But that constraint is itself instructive: waterfront real estate is inherently thinly traded.
A buyer evaluating a South Tampa waterfront property should look well beyond price per square foot. Water frontage, canal characteristics, bridge access, orientation, seawall condition, dockage, elevation, flood considerations, lot dimensions, construction quality, and redevelopment potential can make seemingly similar properties materially different.
For sellers, applying a neighborhood average to an unusual waterfront asset can produce a misleading valuation. For buyers, waiting for a statistically perfect comparable may be equally problematic. In genuinely scarce markets, the more useful question may be what it would cost — or whether it would even be possible — to replicate the property elsewhere.
What Current Inventory Tells South Tampa Sellers
A telling contrast appears when trailing sales are compared with today's active inventory.
Across the four ZIP codes analyzed, the median cumulative market time for $1 million-plus closed sales was approximately 42 days. For today's active listings, it is approximately 85 days. At $5 million and above, the active median rises to approximately 127 days.
Current asking prices tell an equally important story about positioning.
In the $1 million to $1.5 million segment, the median active asking price per square foot is approximately $423 — essentially identical to the approximately $423 per square foot achieved by trailing closed sales.
Between $1.5 million and $2.5 million, active inventory is asking approximately $546 per square foot, compared with approximately $512 per square foot for trailing sales. Between $2.5 million and $5 million, current asking prices carry a median of approximately $657 per square foot versus approximately $618 for trailing closed transactions.
No individual home should be valued from those figures alone. Collectively, however, they illustrate an important dynamic: in portions of the upper-luxury market, sellers are asking buyers to absorb higher pricing at a moment when those buyers have more alternatives from which to choose. That makes positioning increasingly consequential.
What the Fall 2026 Market Means for South Tampa Sellers
In a rapidly appreciating market, momentum can sometimes offset imperfect pricing or preparation. A more selective market is less forgiving.
The question for a luxury seller is not simply, "What did the house down the street sell for?" A more useful analysis identifies what the property's true competitive alternatives are, which characteristics a buyer can readily find elsewhere, which are genuinely scarce, how the property compares with new or recently renovated inventory, what compromises a buyer is likely to perceive, how large the probable buyer pool is at the proposed price, and — perhaps most importantly — what evidence supports the premium being requested.
At the upper end of the market, pricing, presentation, property preparation, and marketing exposure should function as one coordinated strategy. The objective isn't to be the least expensive alternative. It is to make the property's value proposition clear enough that a qualified buyer understands why it warrants consideration relative to everything else available.
What the Fall 2026 Market Means for South Tampa Buyers
Buyers should be equally careful with broad-market conclusions.
Approximately 7.3 months of apparent supply between $2.5 million and $5 million doesn't make every property in that range a negotiating opportunity. Nor does approximately 12 months of apparent supply above $5 million mean that an exceptional property will remain available while a buyer waits for the market to shift.
The better approach is to separate replaceable inventory from scarce inventory.
Where comparable alternatives exist, patience and negotiation may be rewarded. Where a property possesses characteristics that are genuinely difficult to reproduce — a particular waterfront position, exceptional homesite, unusual architecture, superior construction, or a highly desirable micro-location — the analysis changes.
The goal isn't simply to purchase below the asking price. It is to understand whether the asset represents compelling value relative to its actual alternatives.
The Question That Matters: What Is the Market for This Property?
South Tampa continues to offer some of Tampa Bay's most desirable residential real estate. But desirability does not mean every property, neighborhood, or price category behaves the same way.
The current data reflects an increasingly segmented luxury market. Below approximately $2.5 million, available supply remains relatively contained based on the trailing sales pace. Above that level, buyers generally have more alternatives, marketing periods lengthen, and property-specific differentiation carries greater weight.
Waterfront adds another layer of complexity. Within every category, individual characteristics can overwhelm broad averages.
For buyers and sellers considering a significant South Tampa real estate decision this fall, the most useful question may therefore have less to do with whether "the market" is up or down.
It may simply be:
What is the market for this particular property?
That is where the analysis should begin.
About the Author
Jeramiah J. Bustin is a Broker Associate and License Partner with Engel & Völkers South Tampa. A Tampa native with approximately 25 years of residential brokerage experience, his practice focuses on South Tampa luxury and waterfront real estate.
Market Data & Methodology
Market statistics are based on Stellar MLS data analyzed in early September 2026 for single-family residential properties with closed or active prices of $1 million or more in ZIP codes 33606, 33609, 33611, and 33629. Closed-sale statistics generally reflect the preceding 12 months through August 2026. Waterfront subsets contain relatively small sample sizes and should not be interpreted as independent appraisals or predictions of future performance. Apparent months of supply is calculated using current active inventory relative to the trailing 12-month closed-sales pace. Individual property values require property-specific analysis.
Categories
Recent Posts


Jeramiah Bustin
License Partner | Broker Associate | Professional Athlete Advisory | Development Services